MARINE TRL 6 TEST RESULTS
Marine TRL-6 Comparison Report: Baseline vs. Pure EV
Test Summary
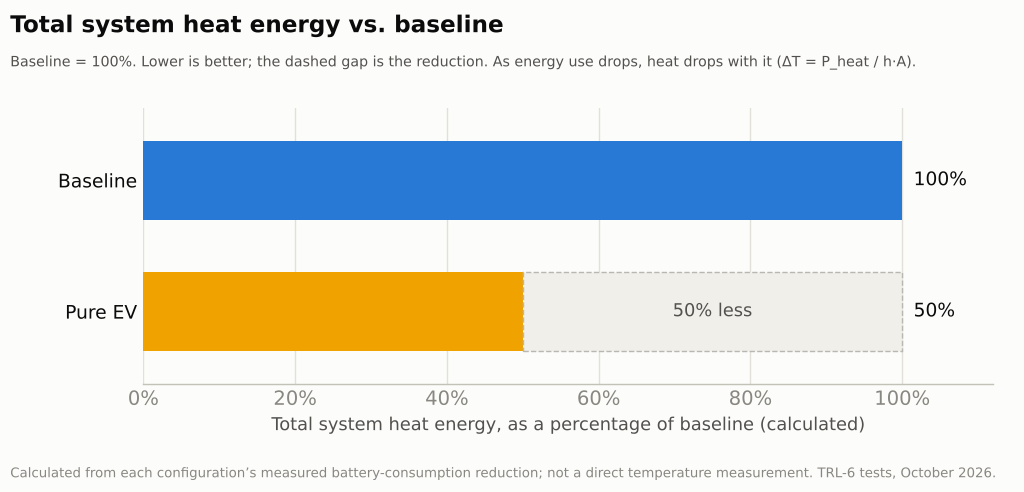
| Measured battery-consumption reduction | 50% |
| Calculated battery-runtime increase | 100% |
Test Configuration
Testing was conducted using a marine TRL-6 demonstration platform within an approximately 10-foot transparent polycarbonate shell. The batteries, inverter, motor, electrical hardware, instrumentation, and associated test equipment were contained within the test space during operation.
The propulsion/load assembly used a 1/2-horsepower electric motor driving a shaft and propeller, providing a continuous and visibly operating physical load during the recorded test.
The 1/2-horsepower motor was controlled by a simple ON/OFF switch. When energized, the motor was operated under the same fixed control condition for the baseline and comparison test; no variable-speed, throttle, or intermediate motor-control adjustment was used between tests. The visible rotary dial was inoperative and remained fixed at a high-speed setting during testing.
The baseline and comparison configurations used the same core test platform, motor/load assembly, battery system, inverter, measurement equipment, wiring, and test environment, except as described below. The baseline was operated without the Generative Kinetics technology. The comparison configuration used the same core platform with the Generative Kinetics technology present.
The Pure EV configuration did not include the additional onboard energy source or associated charging equipment used in ongoing Hybrid and Plug-in Hybrid test configurations.
Visual Documentation and Test Boundary
The test was recorded from both frontal and side camera views. Because the marine shell is transparent, the recordings show the test space and the contained operating hardware from two perspectives. The recorded views document that no external electrical supply cables entered the test article and no electrical output cables left the test article during the recorded test period.
Measurement and Runtime Calculation
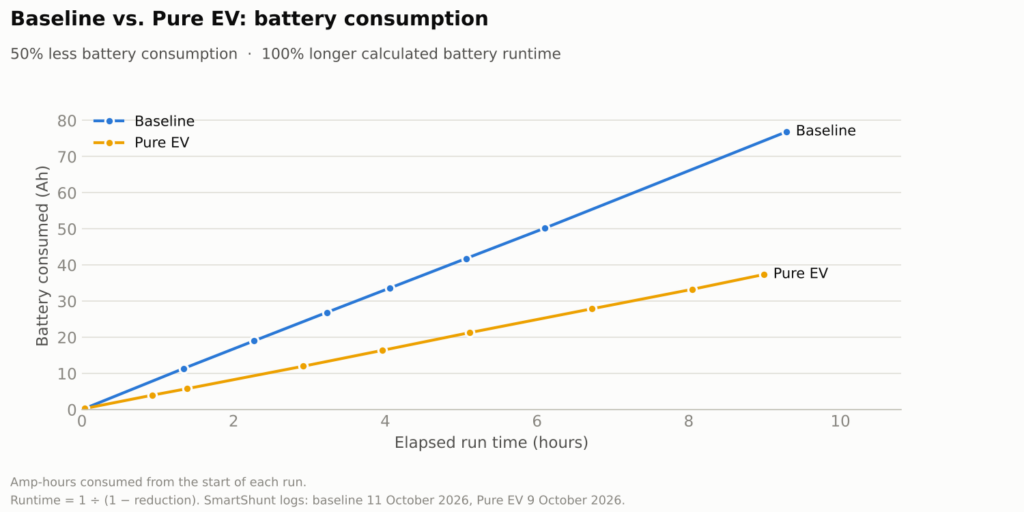
The baseline and Pure EV battery-consumption results were measured independently under the stated test conditions. The 50% comparative reduction was then mathematically calculated from those independently measured results.
Battery consumption was measured with a SmartShunt battery monitor. Baseline test: 11 October 2026. Pure EV test: 9 October 2026. The recorded test runs averaged approximately 8.5 hours.
State of charge was not used as the sole basis for the comparative percentage, because the tests did not go to full battery depletion. The video timeline annotates the duration of each test. Although the primary test objective was to quantify efficiency, state of charge was also directly observable at the end of each test without requiring full battery depletion.
The corresponding runtime increase is mathematically calculated from the end-of-test measured consumption reduction using the relationship Runtime Factor = 1 / (1 – consumption reduction). For a 50% reduction, this corresponds to 100.00% longer battery runtime. For concise reporting, that calculated result is stated as 100% longer battery runtime.
Reported Comparative Result
Pure EV – 50% measured lower battery consumption than baseline, mathematically corresponding to 100% longer battery runtime under the same stated test conditions.
Proprietary design details are not disclosed. Patent Pending.